
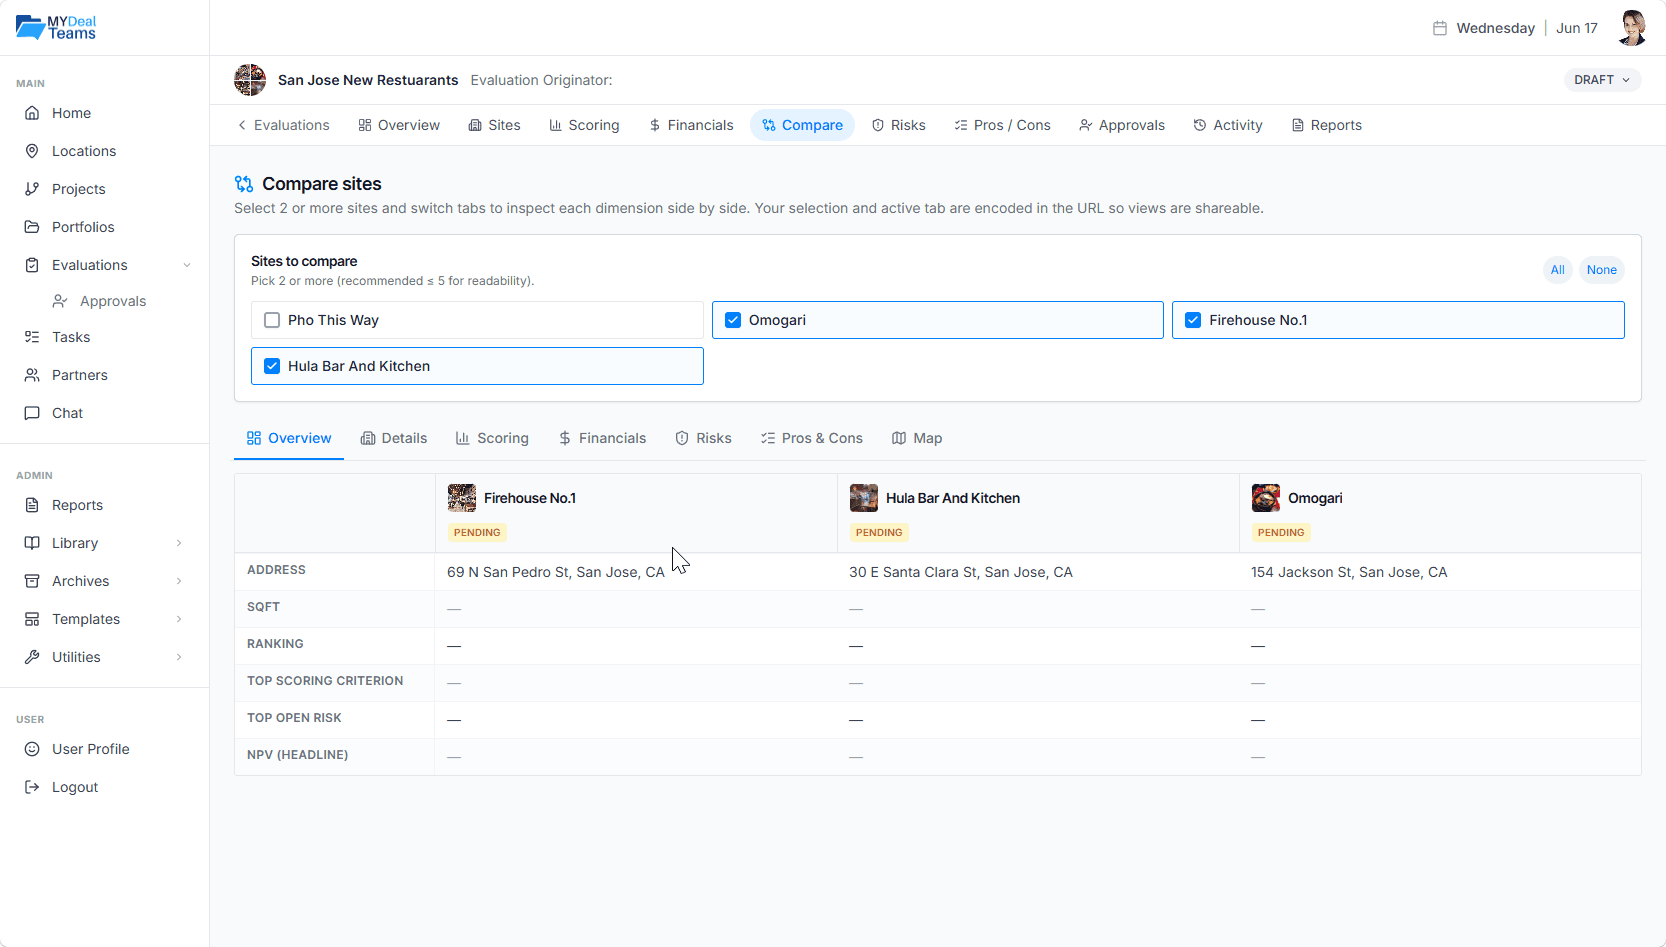
See Sites Side-By-Side
Pick any two or more candidate sites inside an evaluation and compare them across maps, demographics, financials, scores, risks, and pros & cons — all in one view.
Why Comparison Decks Hide the Differences
PowerPoint comparison slides are easy to make and hard to trust.
Different data per slide
The columns don't line up because the underlying data is from different sources.
No live updates
By the time the deck is finalized, the comparison is already outdated.
Visual noise
Maps, demographics, and financials end up on different slides — never the same view.
What MyDealTeams Does
Comparisons pull live data from the underlying location and evaluation records.
Pick any subset
Compare 2, 3, or all sites in an evaluation — toggle on and off live.
Synchronized maps
Each site renders with its own map; pan and zoom together for context.
Demographics in parallel
Population, income, trade area — same metrics, same scale, every site.
Financial side-by-side
Pro forma metrics aligned row-by-row for fast spotting of differences.
Score comparison
See where sites rank across each scoring criterion at a glance.
Export to packet
Generate a comparison-ready report you can share with partners.
How Teams Use It
Final-round decisions
Pull the top 3 candidates into a comparison view for the call.
Investor packets
Generate a comparison report that explains why one site won.
Strategy reviews
Compare against benchmark sites in existing portfolio to test fit.